
Worked example: analytical and data services
A habitat model for a Wild Turkey hunt
In April 2026 a client hunted Merriam’s Wild Turkeys in a game management unit where public bird records were few. I built her a scouting report around a habitat model: where in the unit the birds were most likely to be that month, and how to reach those places.
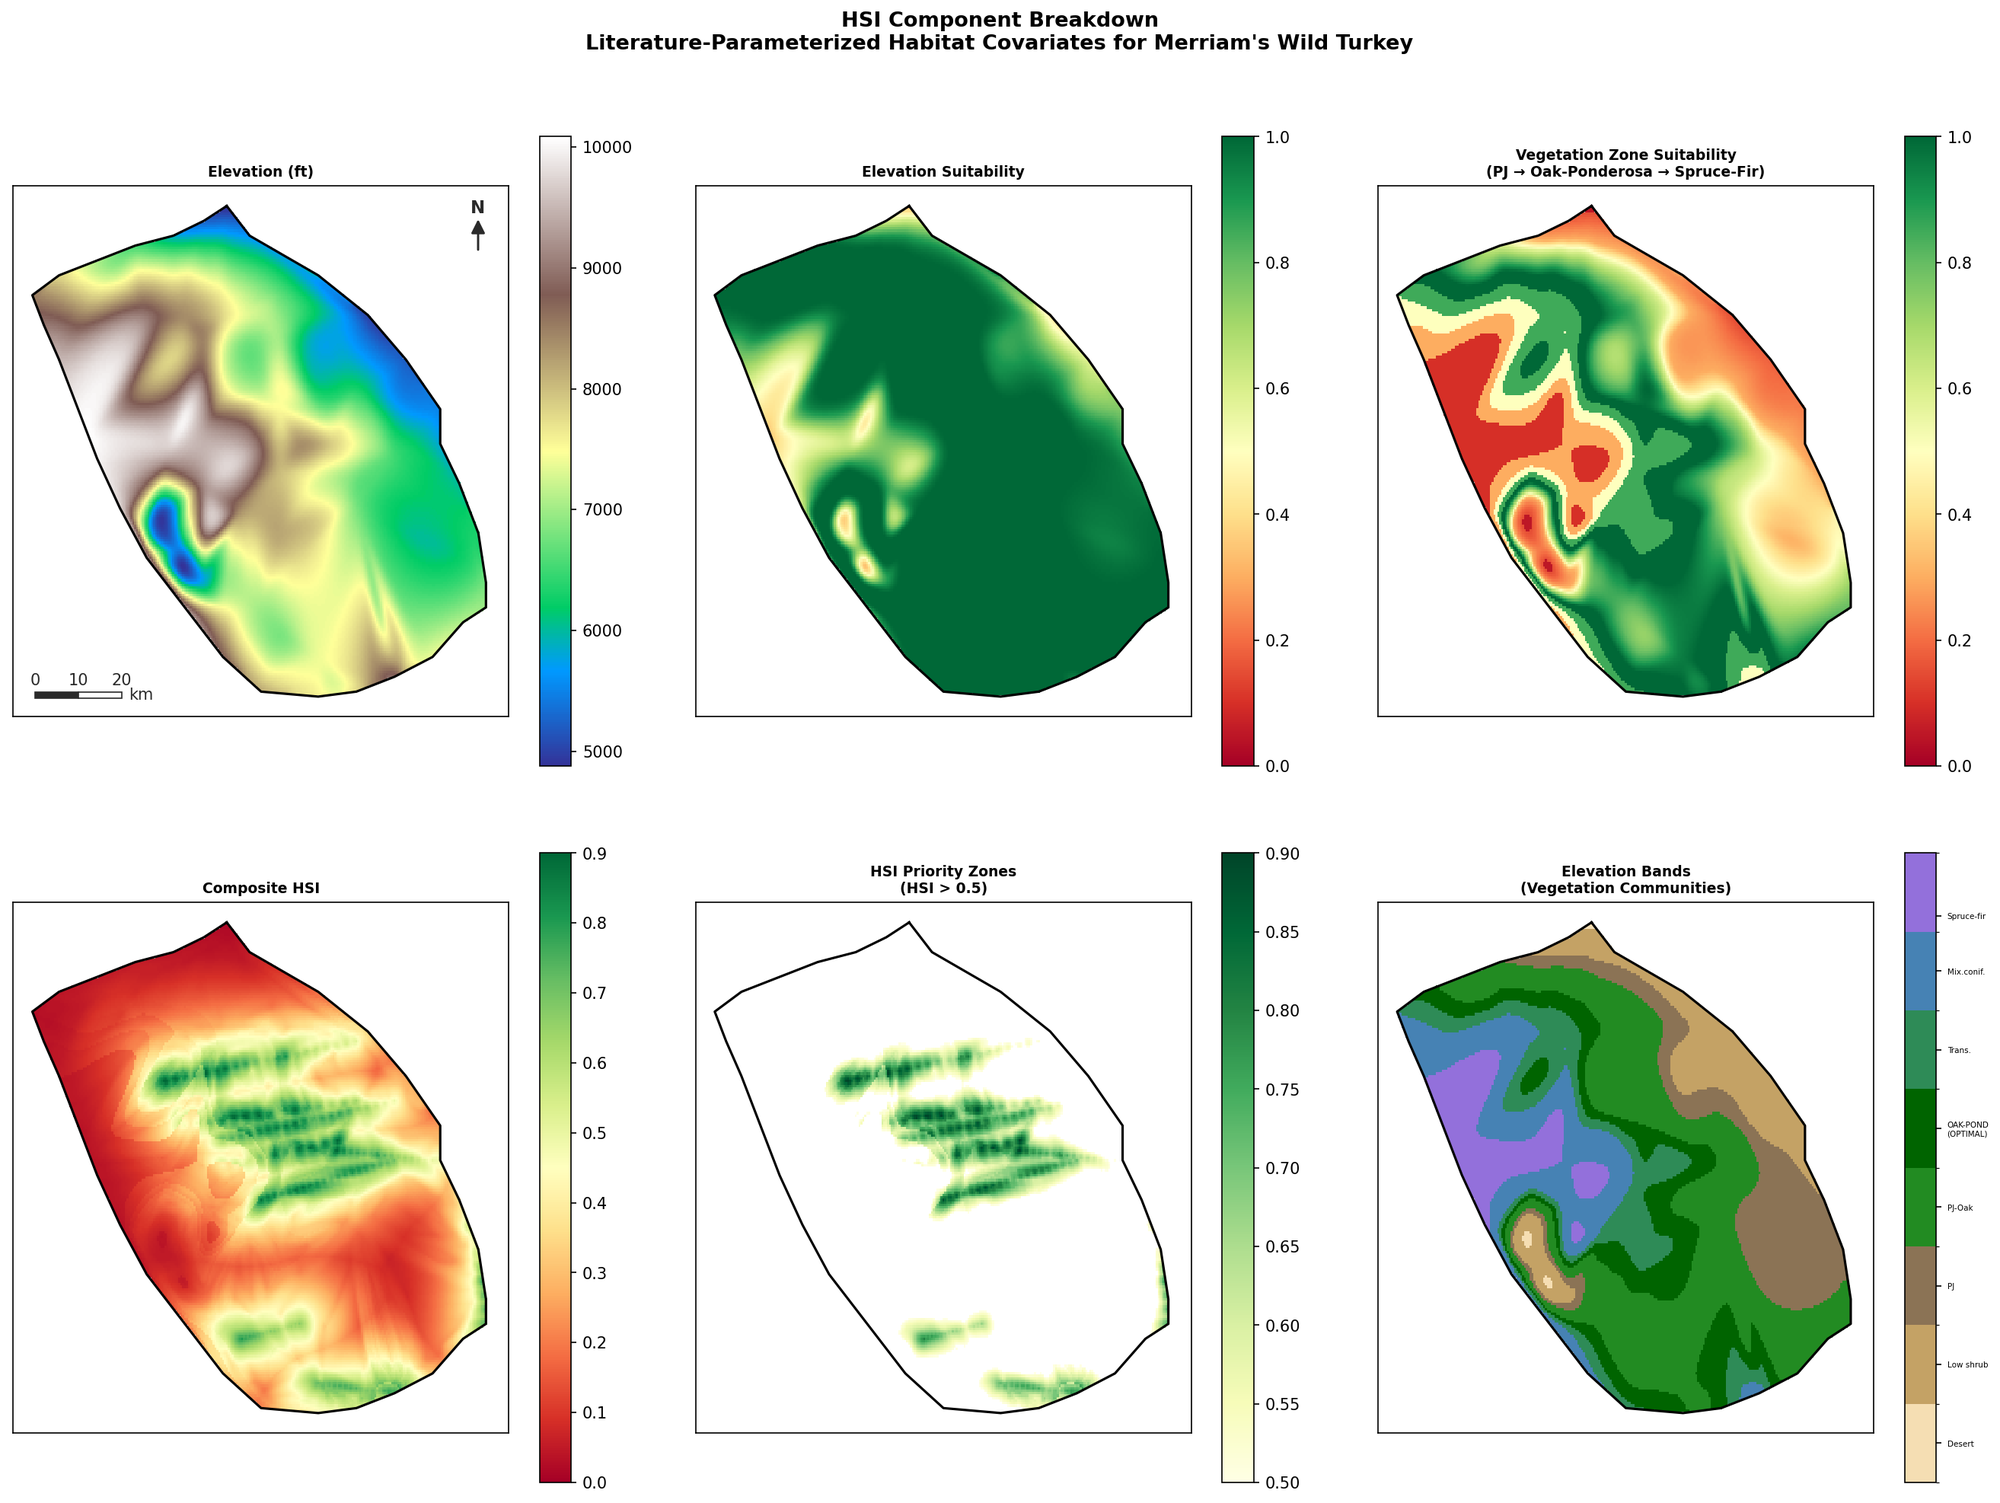
The model is a habitat suitability index built from the published research on Merriam’s Wild Turkeys. It combines seven habitat measures (vegetation zone, elevation, distance to water, edge density, slope, topographic position, and aspect), each weighted by its importance in that research, on a grid of cells about 500 meters across. Cells scoring above 0.5 on the index became the priority zones, and the best spring habitat in the model is the band of ponderosa pine and Gambel oak between 7,500 and 8,000 feet.
The report gave her the model and its maps, three priority zones, five scouting routes with 23 waypoints ready to load into a phone mapping app, the maps and sources for checking roads and land ownership on the ground, and a plain list of the model’s limits. She took a Merriam’s tom on the trip.

To discuss a project, write to me at grishamfieldandfeather@gmail.com.